Statistics
Open Overview → Statistics. Available sections depend on role: administrators see the full dashboard and employees see statistics for their area.
Select a period
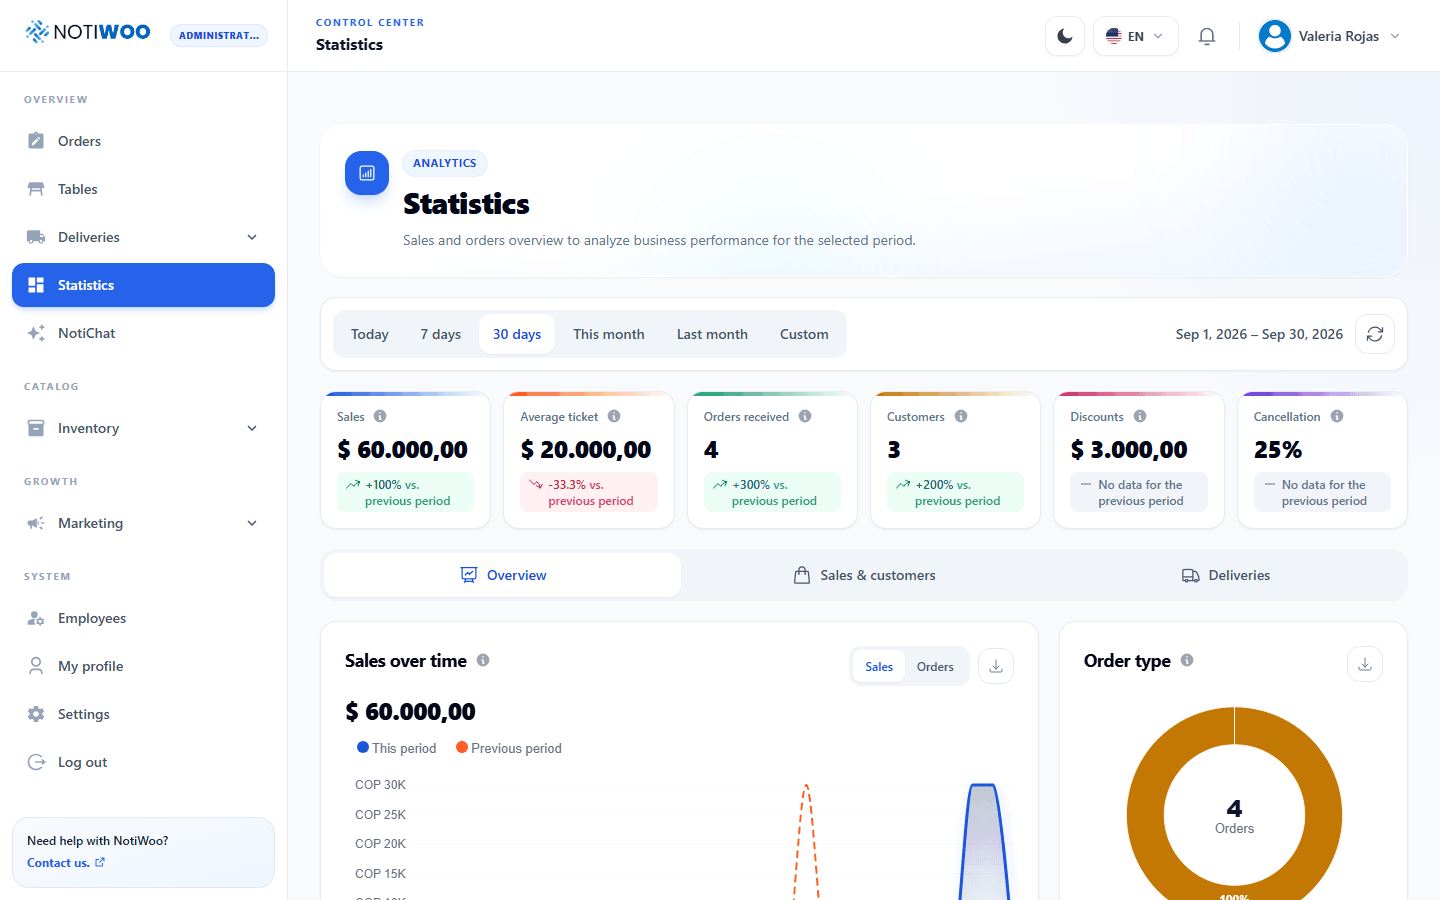
Use predefined periods or Custom start and end dates. The selected period is shared across dashboard cards. Indicators compare with the previous period when sufficient data exists.
Overview
Review sales, orders and key indicators; the time chart shows their evolution. The heatmap highlights busy days and hours. Order-type and status cards help explain the operational mix.
Sales and customers
This tab groups best-selling products, payment methods, coupons, discounts and customers. Products may include an image when available. Check units, amounts and period before comparing.
Deliveries
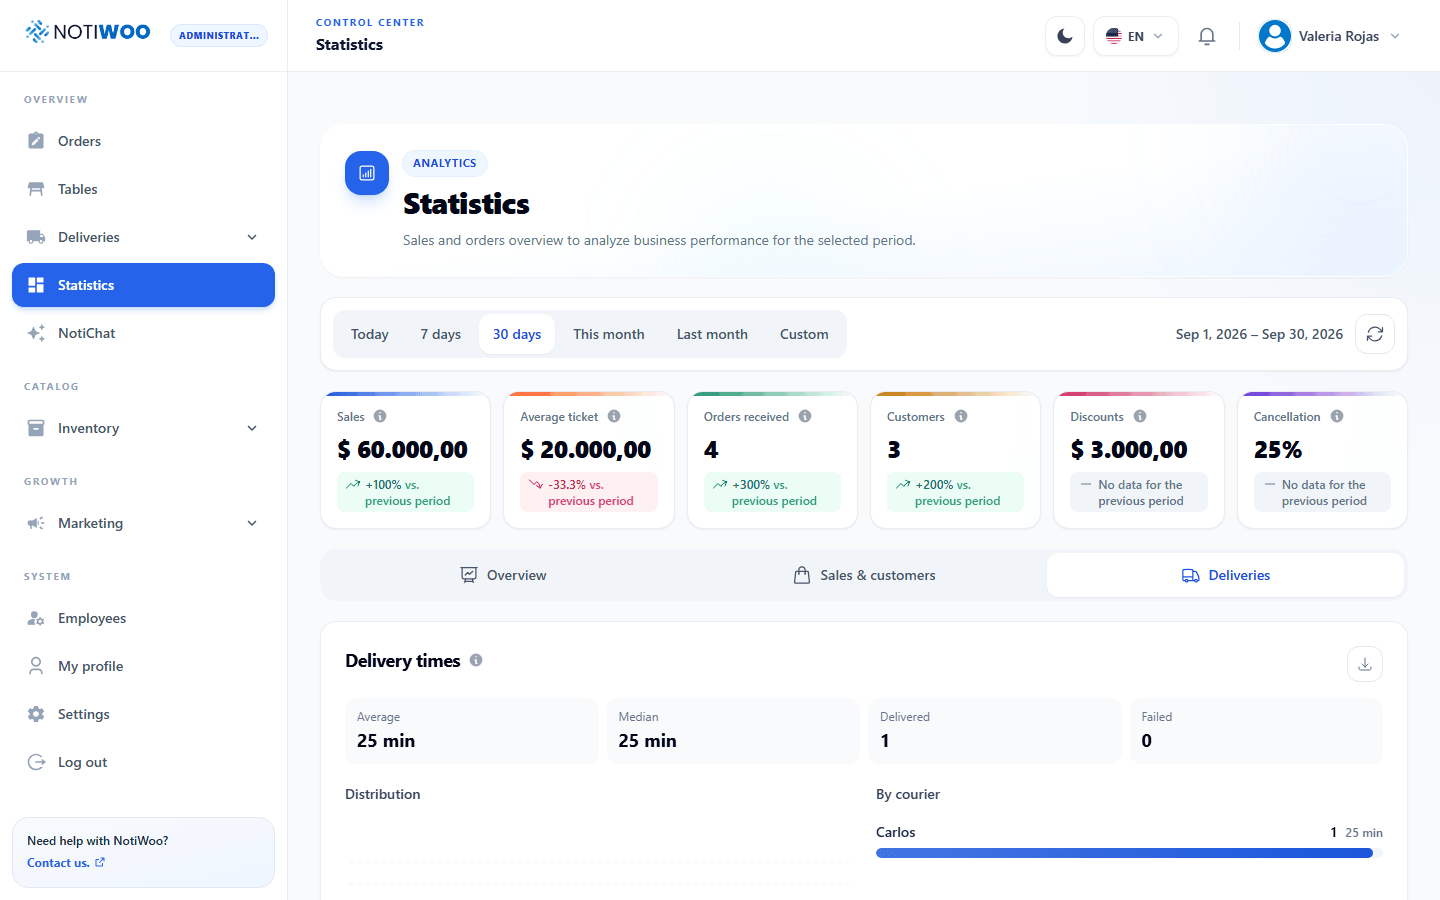
Review delivery times and results by courier. A duration needs records of its stages; a delivery without enough events should not be interpreted as instantaneous.
Export and compare
Each card offers CSV where export is available. The file corresponds to its data and selected period.
When comparing with WooCommerce, use the same period, time zone, currency and sales criteria. Completed order counts do not automatically equal revenue: distinguish operations from finalized sales.